Features
Copyright 2014-2020 Anthony Larcher and Sylvain Meignier
frontend provides methods to process an audio signal in order to extract
useful parameters for speaker verification.
-
frontend.features.audspec(power_spectrum, fs=16000, nfilts=None, fbtype='bark', minfreq=0, maxfreq=8000, sumpower=True, bwidth=1.0)[source]¶ - Parameters
power_spectrum –
fs –
nfilts –
fbtype –
minfreq –
maxfreq –
sumpower –
bwidth –
- Returns
-
frontend.features.bark2hz(z)[source]¶ Converts frequencies Bark to Hertz (Hz)
- Parameters
z –
- Returns
-
frontend.features.compute_delta(features, win=3, method='filter', filt=array([0.25, 0.5, 0.25, 0.0, - 0.25, - 0.5, - 0.25]))[source]¶ features is a 2D-ndarray each row of features is a a frame
- Parameters
features – the feature frames to compute the delta coefficients
win – parameter that set the length of the computation window. The size of the window is (win x 2) + 1
method – method used to compute the delta coefficients can be diff or filter
filt – definition of the filter to use in “filter” mode, default one is similar to SPRO4: filt=numpy.array([.2, .1, 0, -.1, -.2])
- Returns
the delta coefficients computed on the original features.
-
frontend.features.dct_basis(nbasis, length)[source]¶ - Parameters
nbasis – number of CT coefficients to keep
length – length of the matrix to process
- Returns
a basis of DCT coefficients
-
frontend.features.dolpc(x, model_order=8)[source]¶ compute autoregressive model from spectral magnitude samples
- Parameters
x –
model_order –
- Returns
-
frontend.features.fft2barkmx(n_fft, fs, nfilts=0, width=1.0, minfreq=0.0, maxfreq=8000)[source]¶ Generate a matrix of weights to combine FFT bins into Bark bins. n_fft defines the source FFT size at sampling rate fs. Optional nfilts specifies the number of output bands required (else one per bark), and width is the constant width of each band in Bark (default 1). While wts has n_fft columns, the second half are all zero. Hence, Bark spectrum is fft2barkmx(n_fft,fs) * abs(fft(xincols, n_fft)); 2004-09-05 dpwe@ee.columbia.edu based on rastamat/audspec.m
- Parameters
n_fft – the source FFT size at sampling rate fs
fs – sampling rate
nfilts – number of output bands required
width – constant width of each band in Bark (default 1)
minfreq –
maxfreq –
- Returns
a matrix of weights to combine FFT bins into Bark bins
-
frontend.features.fft2melmx(n_fft, fs=8000, nfilts=0, width=1.0, minfreq=0, maxfreq=4000, htkmel=False, constamp=False)[source]¶ Generate a matrix of weights to combine FFT bins into Mel bins. n_fft defines the source FFT size at sampling rate fs. Optional nfilts specifies the number of output bands required (else one per “mel/width”), and width is the constant width of each band relative to standard Mel (default 1). While wts has n_fft columns, the second half are all zero. Hence, Mel spectrum is fft2melmx(n_fft,fs)*abs(fft(xincols,n_fft)); minfreq is the frequency (in Hz) of the lowest band edge; default is 0, but 133.33 is a common standard (to skip LF). maxfreq is frequency in Hz of upper edge; default fs/2. You can exactly duplicate the mel matrix in Slaney’s mfcc.m as fft2melmx(512, 8000, 40, 1, 133.33, 6855.5, 0); htkmel=1 means use HTK’s version of the mel curve, not Slaney’s. constamp=1 means make integration windows peak at 1, not sum to 1. frqs returns bin center frqs.
% 2004-09-05 dpwe@ee.columbia.edu based on fft2barkmx
- Parameters
n_fft –
fs –
nfilts –
width –
minfreq –
maxfreq –
htkmel –
constamp –
- Returns
-
frontend.features.framing(sig, win_size, win_shift=1, context=0, 0, pad='zeros')[source]¶ - Parameters
sig – input signal, can be mono or multi dimensional
win_size – size of the window in term of samples
win_shift – shift of the sliding window in terme of samples
context – tuple of left and right context
pad – can be zeros or edge
-
frontend.features.hz2bark(f)[source]¶ Convert frequencies (Hertz) to Bark frequencies
- Parameters
f – the input frequency
- Returns
-
frontend.features.hz2mel(f, htk=True)[source]¶ Convert an array of frequency in Hz into mel.
- Parameters
f – frequency to convert
- Returns
the equivalence on the mel scale.
-
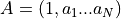
frontend.features.levinson(r, order=None, allow_singularity=False)[source]¶ Levinson-Durbin recursion.
Find the coefficients of a length(r)-1 order autoregressive linear process
- Parameters
r – autocorrelation sequence of length N + 1 (first element being the zero-lag autocorrelation)
order – requested order of the autoregressive coefficients. default is N.
allow_singularity – false by default. Other implementations may be True (e.g., octave)
- Returns
the N+1 autoregressive coefficients
the prediction errors
the N reflections coefficients values
This algorithm solves the set of complex linear simultaneous equations using Levinson algorithm.
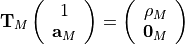
where
 is a Hermitian Toeplitz matrix with elements
 .
.Note
Solving this equations by Gaussian elimination would require
 operations whereas the levinson algorithm
requires
operations whereas the levinson algorithm
requires  additions and multiplications.
This is equivalent to solve the following symmetric Toeplitz system of linear equations
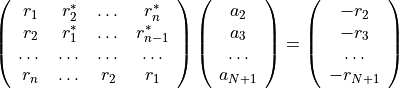
where
 is the input autocorrelation vector, and
 denotes the complex conjugate of
  . The input r is typically
a vector of autocorrelation coefficients where lag 0 is the first
element
. The input r is typically
a vector of autocorrelation coefficients where lag 0 is the first
element  .
.>>> import numpy; from spectrum import LEVINSON >>> T = numpy.array([3., -2+0.5j, .7-1j]) >>> a, e, k = LEVINSON(T)
-
frontend.features.lifter(x, lift=0.6, invs=False)[source]¶ Apply lifter to matrix of cepstra (one per column) lift = exponent of x i^n liftering or, as a negative integer, the length of HTK-style sin-curve liftering. If inverse == 1 (default 0), undo the liftering.
- Parameters
x –
lift –
invs –
- Returns
-
frontend.features.lpc2cep(a, nout)[source]¶ Convert the LPC ‘a’ coefficients in each column of lpcas into frames of cepstra. nout is number of cepstra to produce, defaults to size(lpcas,1) 2003-04-11 dpwe@ee.columbia.edu
- Parameters
a –
nout –
- Returns
-
frontend.features.lpc2spec(lpcas, nout=17)[source]¶ Convert LPC coeffs back into spectra nout is number of freq channels, default 17 (i.e. for 8 kHz)
- Parameters
lpcas –
nout –
- Returns
-
frontend.features.mel2hz(z, htk=True)[source]¶ Convert an array of mel values in Hz.
- Parameters
m – ndarray of frequencies to convert in Hz.
- Returns
the equivalent values in Hertz.
-
frontend.features.mel_filter_bank(fs, nfft, lowfreq, maxfreq, widest_nlogfilt, widest_lowfreq, widest_maxfreq)[source]¶ Compute triangular filterbank for cepstral coefficient computation.
- Parameters
fs – sampling frequency of the original signal.
nfft – number of points for the Fourier Transform
lowfreq – lower limit of the frequency band filtered
maxfreq – higher limit of the frequency band filtered
widest_nlogfilt – number of log filters
widest_lowfreq – lower frequency of the filter bank
widest_maxfreq – higher frequency of the filter bank
widest_maxfreq – higher frequency of the filter bank
- Returns
the filter bank and the central frequencies of each filter
-
frontend.features.mfcc(input_sig, lowfreq=100, maxfreq=8000, nlinfilt=0, nlogfilt=24, nwin=0.025, fs=16000, nceps=13, shift=0.01, get_spec=False, get_mspec=False, prefac=0.97)[source]¶ Compute Mel Frequency Cepstral Coefficients.
- Parameters
input_sig – input signal from which the coefficients are computed. Input audio is supposed to be RAW PCM 16bits
lowfreq – lower limit of the frequency band filtered. Default is 100Hz.
maxfreq – higher limit of the frequency band filtered. Default is 8000Hz.
nlinfilt – number of linear filters to use in low frequencies. Default is 0.
nlogfilt – number of log-linear filters to use in high frequencies. Default is 24.
nwin – length of the sliding window in seconds Default is 0.025.
fs – sampling frequency of the original signal. Default is 16000Hz.
nceps – number of cepstral coefficients to extract. Default is 13.
shift – shift between two analyses. Default is 0.01 (10ms).
get_spec – boolean, if true returns the spectrogram
get_mspec – boolean, if true returns the output of the filter banks
prefac – pre-emphasis filter value
- Returns
the cepstral coefficients in a ndaray as well as the Log-spectrum in the mel-domain in a ndarray.
Note
MFCC are computed as follows:
Pre-processing in time-domain (pre-emphasizing)
Compute the spectrum amplitude by windowing with a Hamming window
- Filter the signal in the spectral domain with a triangular filter-bank, whose filters are approximatively
linearly spaced on the mel scale, and have equal bandwith in the mel scale
Compute the DCT of the log-spectrom
Log-energy is returned as first coefficient of the feature vector.
For more details, refer to [Davis80].
-
frontend.features.pca_dct(cep, left_ctx=12, right_ctx=12, p=None)[source]¶ Apply DCT PCA as in [McLaren 2015] paper: Mitchell McLaren and Yun Lei, ‘Improved Speaker Recognition Using DCT coefficients as features’ in ICASSP, 2015
A 1D-dct is applied to the cepstral coefficients on a temporal sliding window. The resulting matrix is then flatten and reduced by using a Principal Component Analysis.
- Parameters
cep – a matrix of cepstral cefficients, 1 line per feature vector
left_ctx – number of frames to consider for left context
right_ctx – number of frames to consider for right context
p – a PCA matrix trained on a developpment set to reduce the dimension of the features. P is a portait matrix
-
frontend.features.plp(input_sig, nwin=0.025, fs=16000, plp_order=13, shift=0.01, get_spec=False, get_mspec=False, prefac=0.97, rasta=True)[source]¶ output is matrix of features, row = feature, col = frame
% fs is sampling rate of samples, defaults to 8000 % dorasta defaults to 1; if 0, just calculate PLP % modelorder is order of PLP model, defaults to 8. 0 -> no PLP
- Parameters
input_sig –
fs – sampling rate of samples default is 8000
rasta – default is True, if False, juste compute PLP
model_order – order of the PLP model, default is 8, 0 means no PLP
- Returns
matrix of features, row = features, column are frames
-
frontend.features.postaud(x, fmax, fbtype='bark', broaden=0)[source]¶ do loudness equalization and cube root compression
- Parameters
x –
fmax –
fbtype –
broaden –
- Returns
-
frontend.features.power_spectrum(input_sig, fs=8000, win_time=0.025, shift=0.01, prefac=0.97)[source]¶ Compute the power spectrum of the signal. :param input_sig: :param fs: :param win_time: :param shift: :param prefac: :return:
-
frontend.features.shifted_delta_cepstral(cep, d=1, p=3, k=7)[source]¶ Compute the Shifted-Delta-Cepstral features for language identification
- Parameters
cep – matrix of feature, 1 vector per line
d – represents the time advance and delay for the delta computation
k – number of delta-cepstral blocks whose delta-cepstral coefficients are stacked to form the final feature vector
p – time shift between consecutive blocks.
return: cepstral coefficient concatenated with shifted deltas
-
frontend.features.spec2cep(spec, ncep=13, type=2)[source]¶ Calculate cepstra from spectral samples (in columns of spec) Return ncep cepstral rows (defaults to 9) This one does type II dct, or type I if type is specified as 1 dctm returns the DCT matrix that spec was multiplied by to give cep.
- Parameters
spec –
ncep –
type –
- Returns
-
frontend.features.trfbank(fs, nfft, lowfreq, maxfreq, nlinfilt, nlogfilt, midfreq=1000)[source]¶ Compute triangular filterbank for cepstral coefficient computation.
- Parameters
fs – sampling frequency of the original signal.
nfft – number of points for the Fourier Transform
lowfreq – lower limit of the frequency band filtered
maxfreq – higher limit of the frequency band filtered
nlinfilt – number of linear filters to use in low frequencies
nlogfilt – number of log-linear filters to use in high frequencies
midfreq – frequency boundary between linear and log-linear filters
- Returns
the filter bank and the central frequencies of each filter